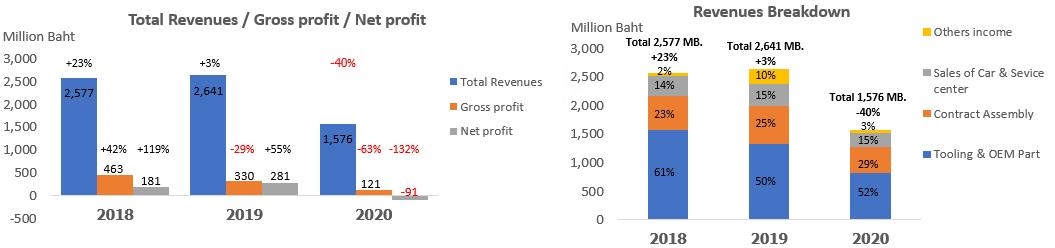
Total Revenues = Sale and Service Revenues + Others income + Share of profit from investments in associated companies
Net Profit (loss) = Net Profit (loss) attributable to Equity holders of the Company
Payment of the dividend payment for the year 2020 is subject to approval by the 2021 Annual General ShareholdersвҖҷ Meeting.
Dividend payment for 2019 paid from ordinary operating profit excluding a non-cash accounting gain from the acquisition of the business of TTR Thairung Co Ltd (TTR).
Compare By Quarter
Q2/2022
Q1/2022
Q2/2021
QoQ% change
YoY% change
Operating (Million Baht)
В
В
В
В
В
Sale and Service Revenues
718.37
663.88
450.25
8%
60%
Total Revenues1
756.74
691.83
463.30
9%
63%
Gross Profit (loss)
167.76
136.93
62.86
23%
167%
EBITDA
154.55
122.13
49.72
27%
211%
EBIT
123.41
90.59
16.34
36%
655%
Net Profit (loss) 2
102.26
72.10
10.28
42%
895%
Financial Position (Million Baht)
Total Assets
4,085.83
4,030.50
3,738.97
1%
9%
Total Liabilities
613.20
606.99
451.00
1%
36%
Total Shareholders' Equity
3,472.63
3,423.52
3,287.98
1%
6%
Financial Ratio
Gross Profit Margin
23.35%
20.63%
13.96%
3%
9%
EBITDA
20.42%
17.65%
10.73%
3%
10%
Net Profit Margin
13.51%
10.42%
2.22%
3%
11%
Returns on Total Assets (ROA)
6.81%
4.10%
1.91%
3%
5%
Returns on Equity (ROE)
6.37%
3.62%
1.68%
3%
5%
Current Ratio
2.81
2.73
2.95
3%
(5%)
Total Debt to Equity Ratio (D/E)
0.18
0.18
0.14
(0%)
29%
Per Share Data (Baht)
Par Value
1.00
1.00
1.00
Book Value Per Share (BVPS)
5.72
5.65
5.47
1%
5%
Earning per Share (EPS)
0.17
0.12
0.02
41%
884%
Share Capital (Million shares)
Registered Share Capital
619.85
619.85
619.85
Paid-up Share Capital
597.20
595.45
591.01
Remark
Total Revenues = Sale and Service Revenues + Others income + Share of profit from investments in associated companies
Net Profit (loss) = Net Profit (loss) attributable to Equity holders of the Company